
Research use only. Not for clinical use.
Organ and Fat Measurements
Organ volumes and density on CT, and fat inside organs, muscle and around the heart on MRI.
Performance on an independent test set
- CT organs, mean Dice
- 0.951
- MRI organs, mean Dice
- 0.882
Why organ and fat measurements
About one adult in four has fatty liver disease (Younossi et al., 2016). On MRI, the fat fraction measures liver fat without a biopsy and agrees well with the biopsy grade (Tang et al., 2015). Fat around the heart has been linked to heart attacks independently of the usual risk factors (Mahabadi et al., 2013).
Organ size and fat show up on scans that are taken for other reasons, but they are rarely measured, because each organ has to be outlined slice by slice.
1.5× risk of coronary events per doubling of heart fat
4,093 adults without heart disease were followed for eight years. Coronary events were five times as common in the quarter with the most fat around the heart as in the quarter with the least, and the link held after the usual risk factors were taken into account.
What it does
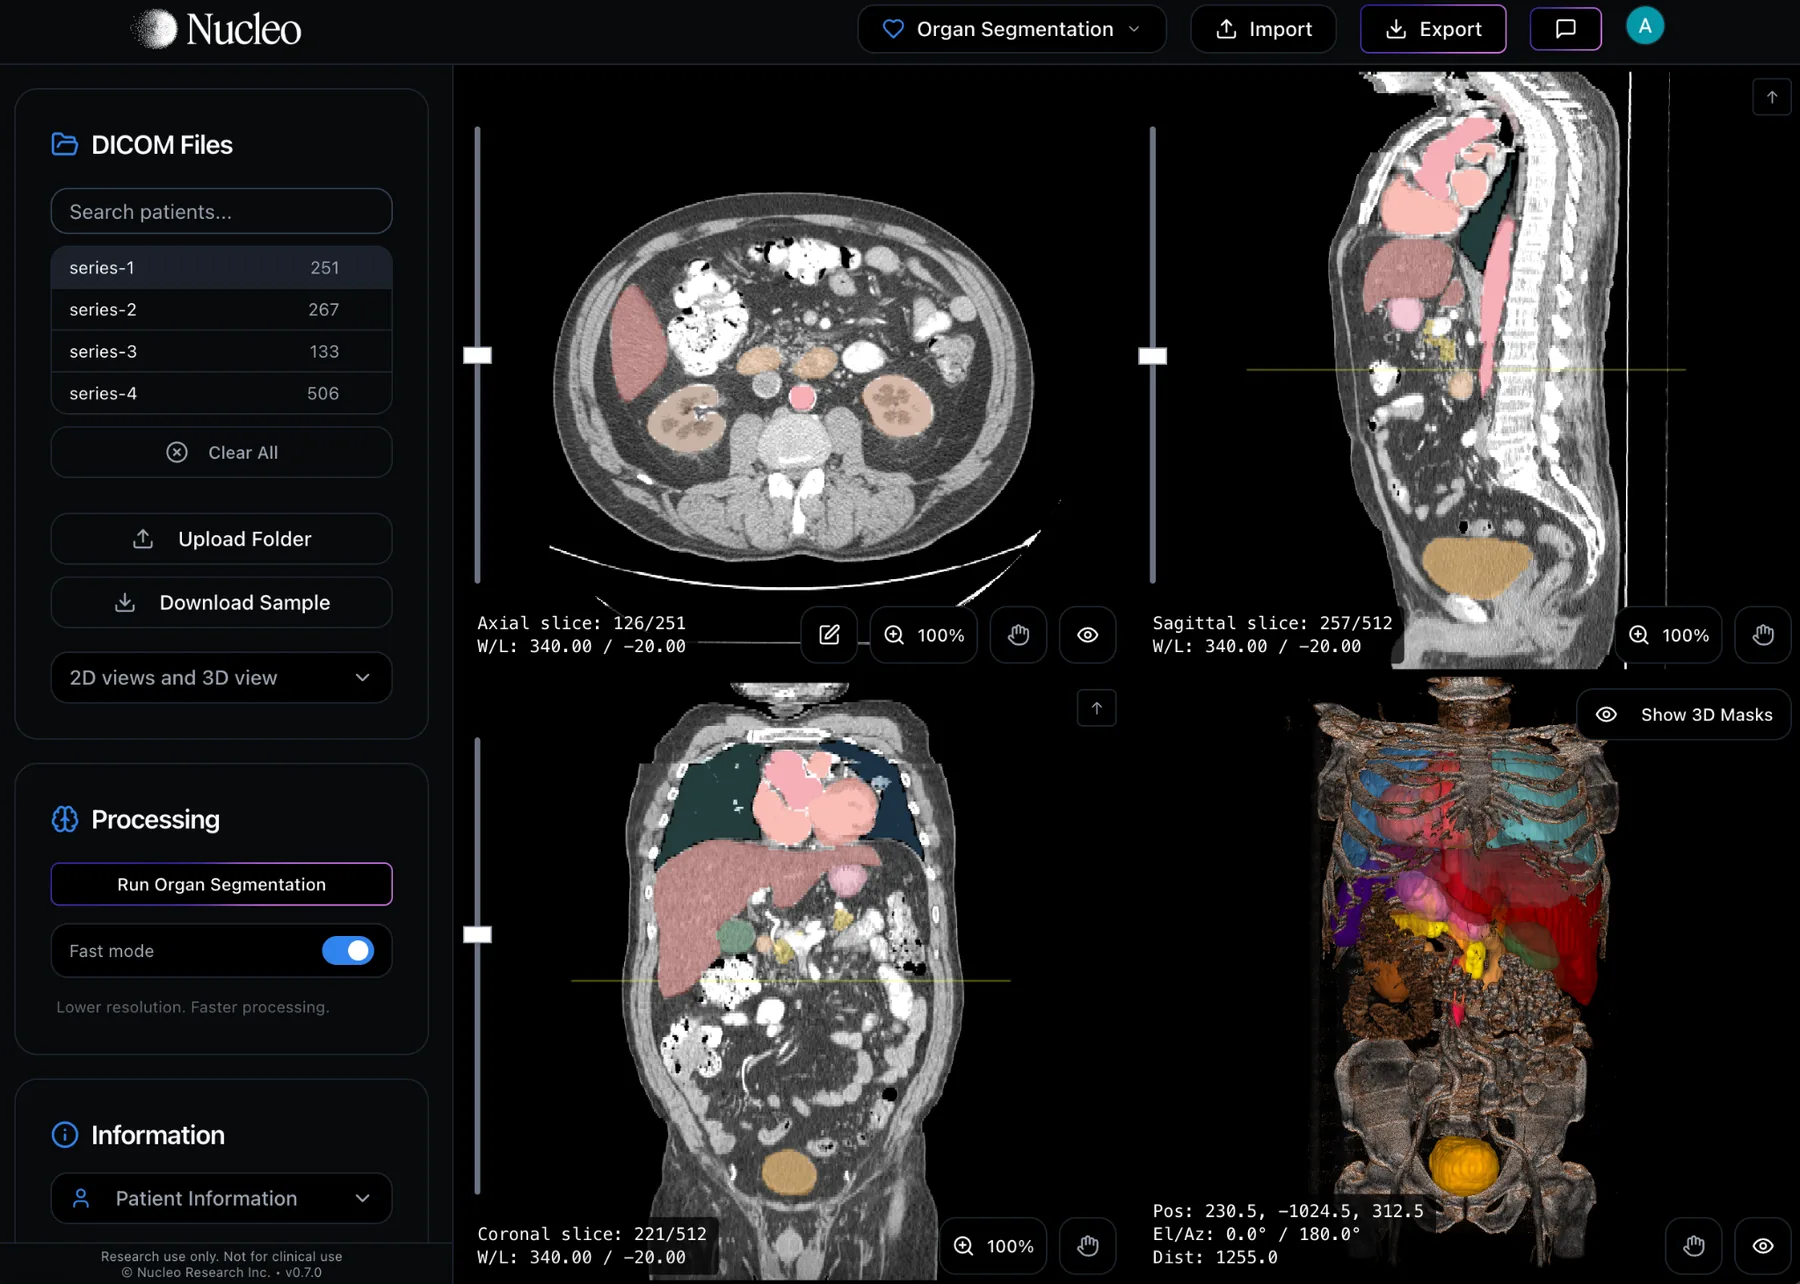
Organ and Fat Measurements outlines organs on CT and MRI and reports the volume of each. On CT it also reports the mean HU, and on scans without contrast, liver attenuation and the pancreas-to-spleen ratio are shown next to common reference values. Both run on Nucleo's cloud.
| CT | MRI | |
|---|---|---|
| Liver | ✓ | ✓ |
| Spleen | ✓ | ✓ |
| Kidneys | ✓ | ✓ |
| Pancreas | ✓ | ✓ |
| Heart | ✓ | ✓ |
| Lungs | ✓ | ✓ |
| Vertebrae | ✓ | ✓ |
| Sacrum | ✓ | ✓ |
| Femurs | ✓ | ✓ |
| Intervertebral discs | – | ✓ |
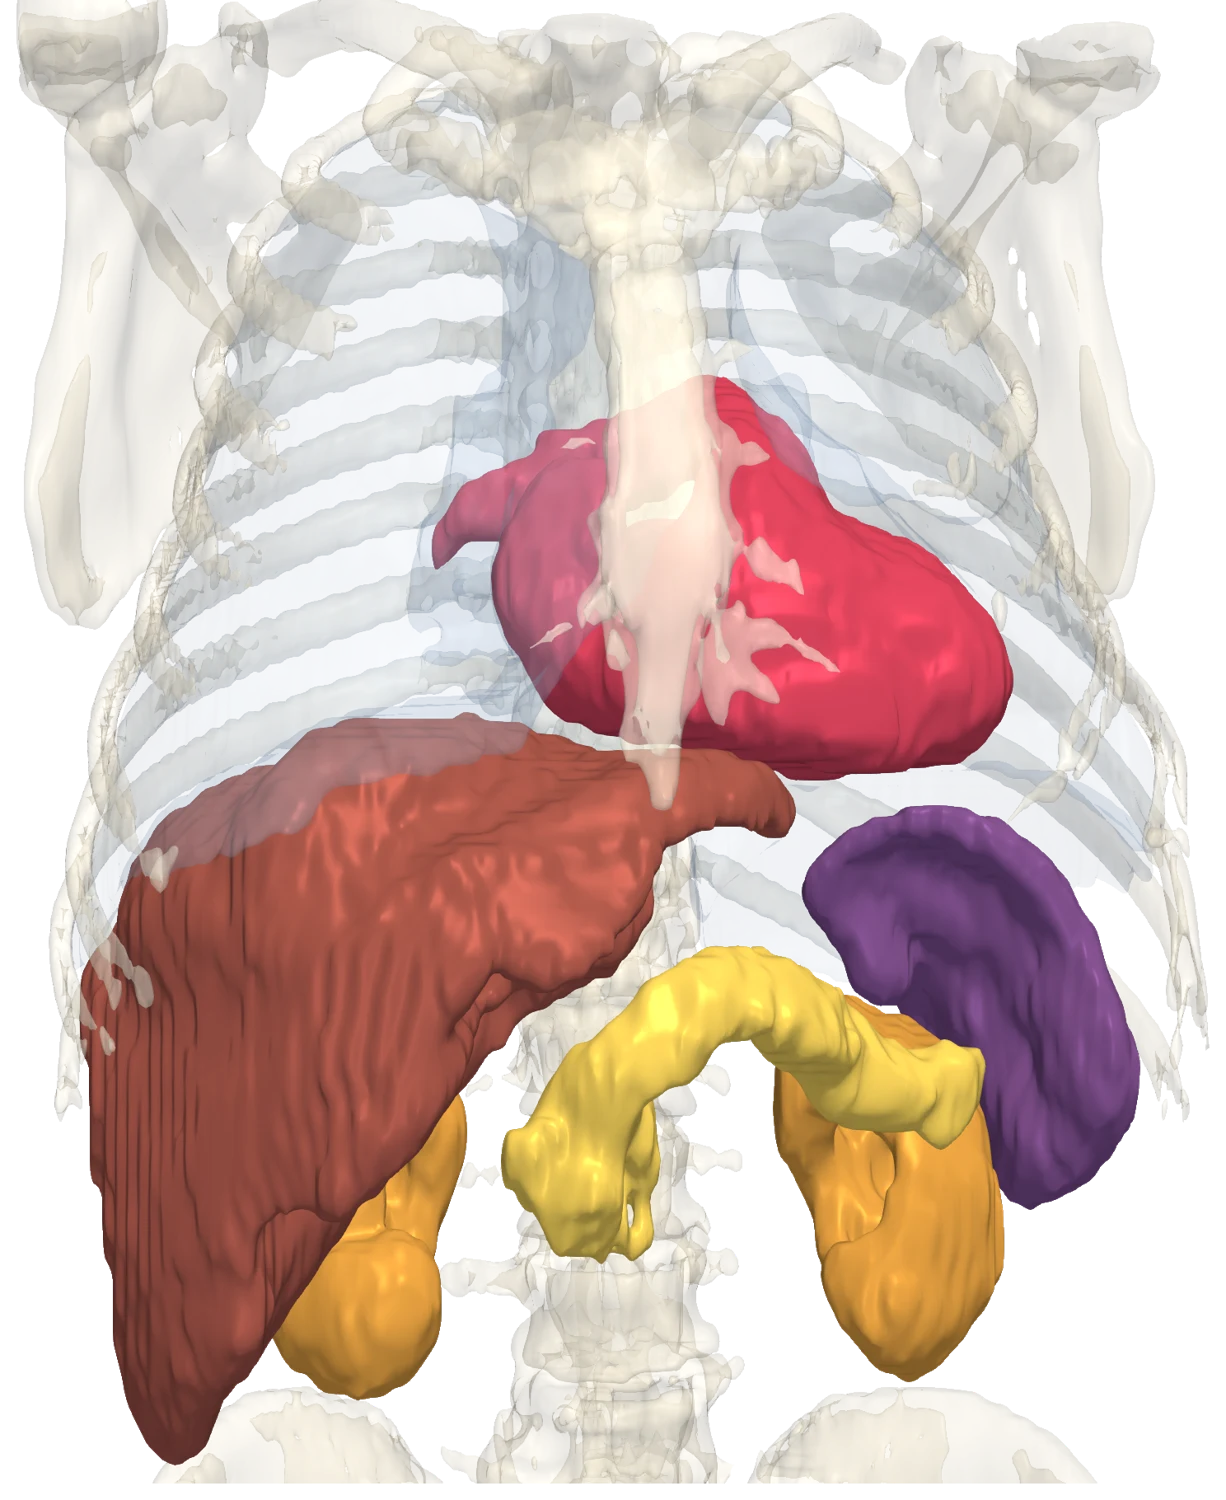
- Liver
- Spleen
- Kidneys
- Pancreas
- Heart
Fat on MRI
Nucleo measures the fat fraction inside the liver, pancreas and kidneys and inside muscle, the fat around the heart, and the fat between muscles.
What you get depends on the images you upload. Any accepted MRI series returns organ volumes, and the same analysis gives body composition on MRI. The table shows the fat results for each input.
| You upload | Organ volumes | Intermuscular fat | Intramuscular fat | Fat fraction |
|---|---|---|---|---|
| Dixon: water + fat imagesWith or without in-phase / out-of-phaseRecommended | Returned | Returned | *Returned | Returned |
| Dixon image + fat-fraction mapWater, in-phase or fat image, same slices as the map | Returned | Returned | *Returned | Returned |
| Dixon: in-phase + out-of-phaseNo separate water / fat | Returned | §Returned | Approximate* | Approximate |
| Dixon: in-phase + waterNo separate fat image | Returned | Approximate | Approximate* | Approximate |
| Single Dixon imageFat, in-phase or water only, no map | Returned | ¶Returned | Needs Water + fat‡ | – |
| Plain T1 (non-Dixon) | Returned | Returned | Needs Dixon | – |
| T2, no fat suppression | Returned | †Returned | Needs Dixon | – |
| Fat-suppressed T2, STIR, IR | Returned | – | – | – |
Accuracy
CT
- 0.9511
- Organ Dice
- 2.6 s2
- Per scan
MRI
- 0.8823
- Organ Dice
- Mean over 12 structures, 65 held-out CT scans.
- Median on an NVIDIA H100 GPU, model loaded.
- Mean over 13 structures, 55 held-out MRI scans.
Questions
Does CT measure fat in organs?
No. CT gives the mean HU inside each organ, with reference values on scans without contrast. Fat fraction is measured on MRI.
Which MRI sequences work for fat fraction?
Dixon fat and water images, a PDFF map, or in-phase and opposed-phase images.
See it on your own scans.
We can walk through Organ and Fat Measurements on a real study and show the outputs end to end.
Book a demo