
Research use only. Not for clinical use.
Lesion Analysis
Find, outline and follow lesions across the body on CT, including lung nodules.
Performance on an independent test set
- Lesion Dice, FLARE 2026
- 81.2%
- Lung nodule sensitivity
- 0.985
Why lesion analysis
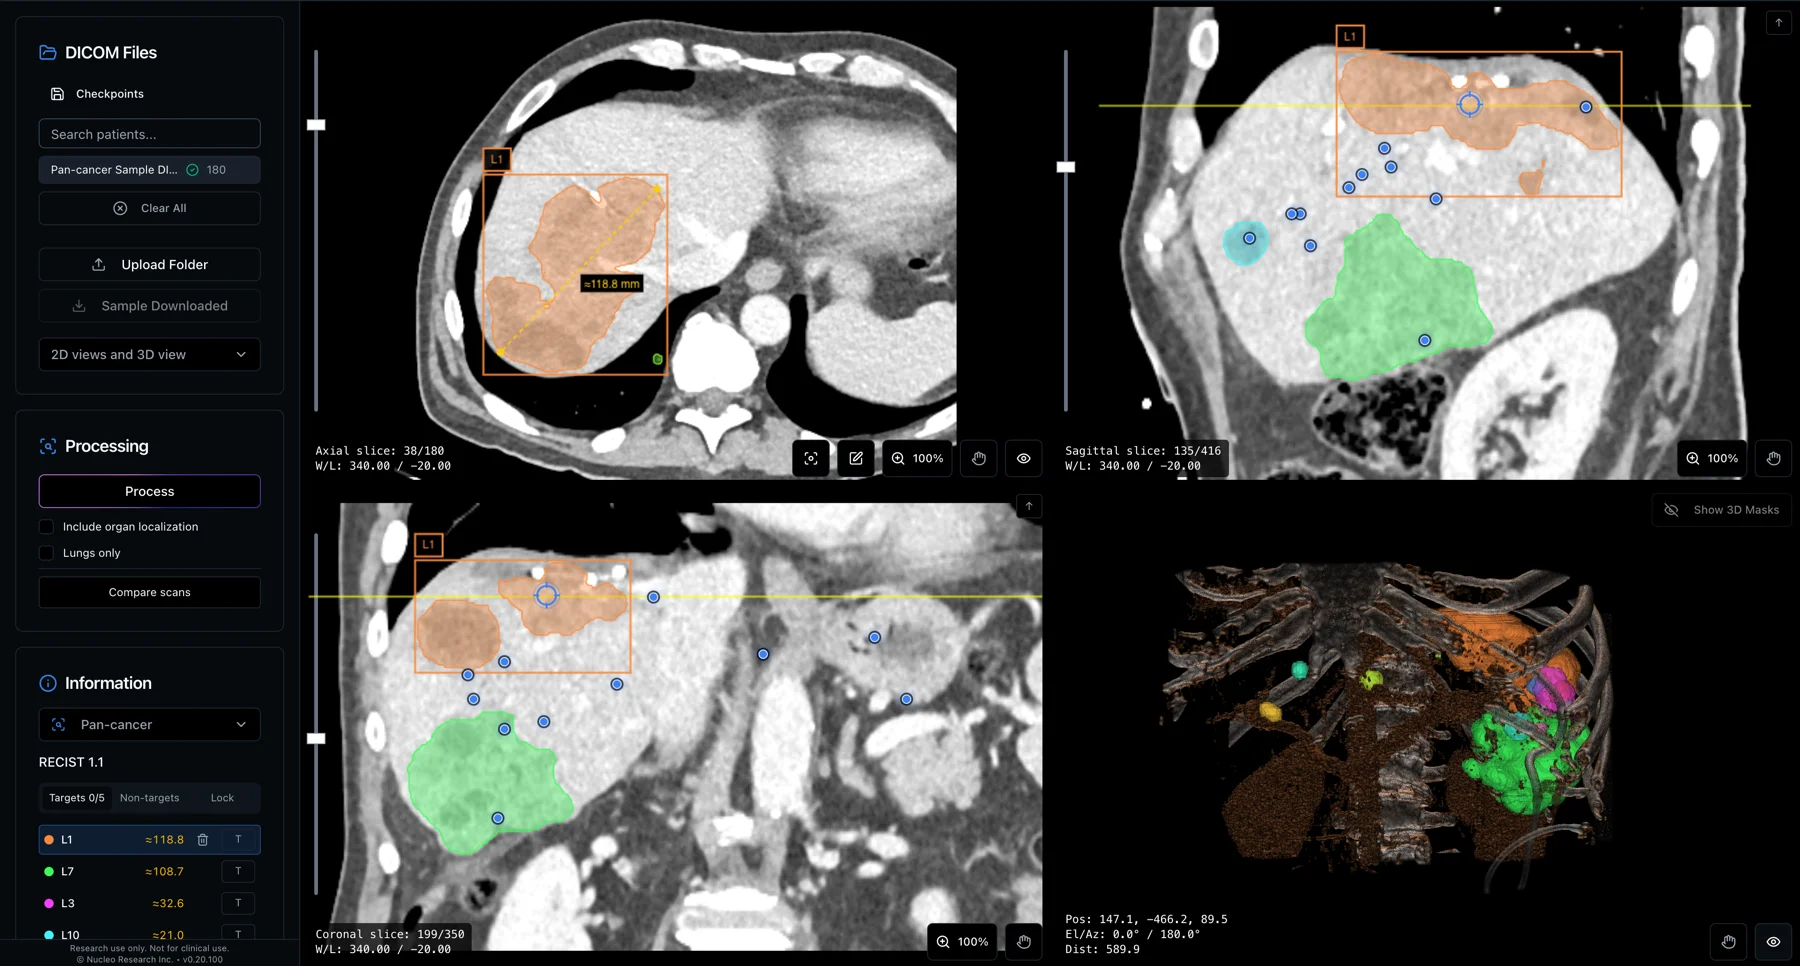
Response to treatment in solid tumours is usually assessed with RECIST 1.1, which follows the diameters of a small set of target lesions measured by hand (Eisenhauer et al., 2009). Manual outlines vary between readers (Joskowicz et al., 2019), and repeat measurements of the same tumour vary even between same-day scans (Zhao et al., 2009). Metastatic disease can appear anywhere in the body, so lesions outside the known sites are easy to miss.
Lung nodules are a common finding on chest CT, both in screening, where low-dose CT has been shown to reduce lung cancer mortality (National Lung Screening Trial, 2011), and as incidental findings. Follow-up depends on a nodule’s size, density and change over time (MacMahon et al., 2017). Measuring nodules by volume works: the NELSON trial, which managed nodules by volume, cut lung-cancer deaths among men by 24% at ten years while referring only 2.1% of participants for suspicious nodules (de Koning et al., 2020).
Outlining every lesion in 3D, the same way each time, makes the whole tumour burden measurable and comparable from one scan to the next.
20.8% variability between readers
Eleven radiologists outlined 3,193 contours on CT. Two readers’ outlines of the same lung tumour differed in volume overlap by 20.8% on average.
What it does
Lesion Analysis is a 3D segmentation model for CT. It finds tumours and other lesions anywhere in the scan and outlines each one. For every lesion it reports the volume, size, density and the organ it is probably in. It was trained on 16,975 CT scans from 28 public datasets. A scan takes about 18 seconds.
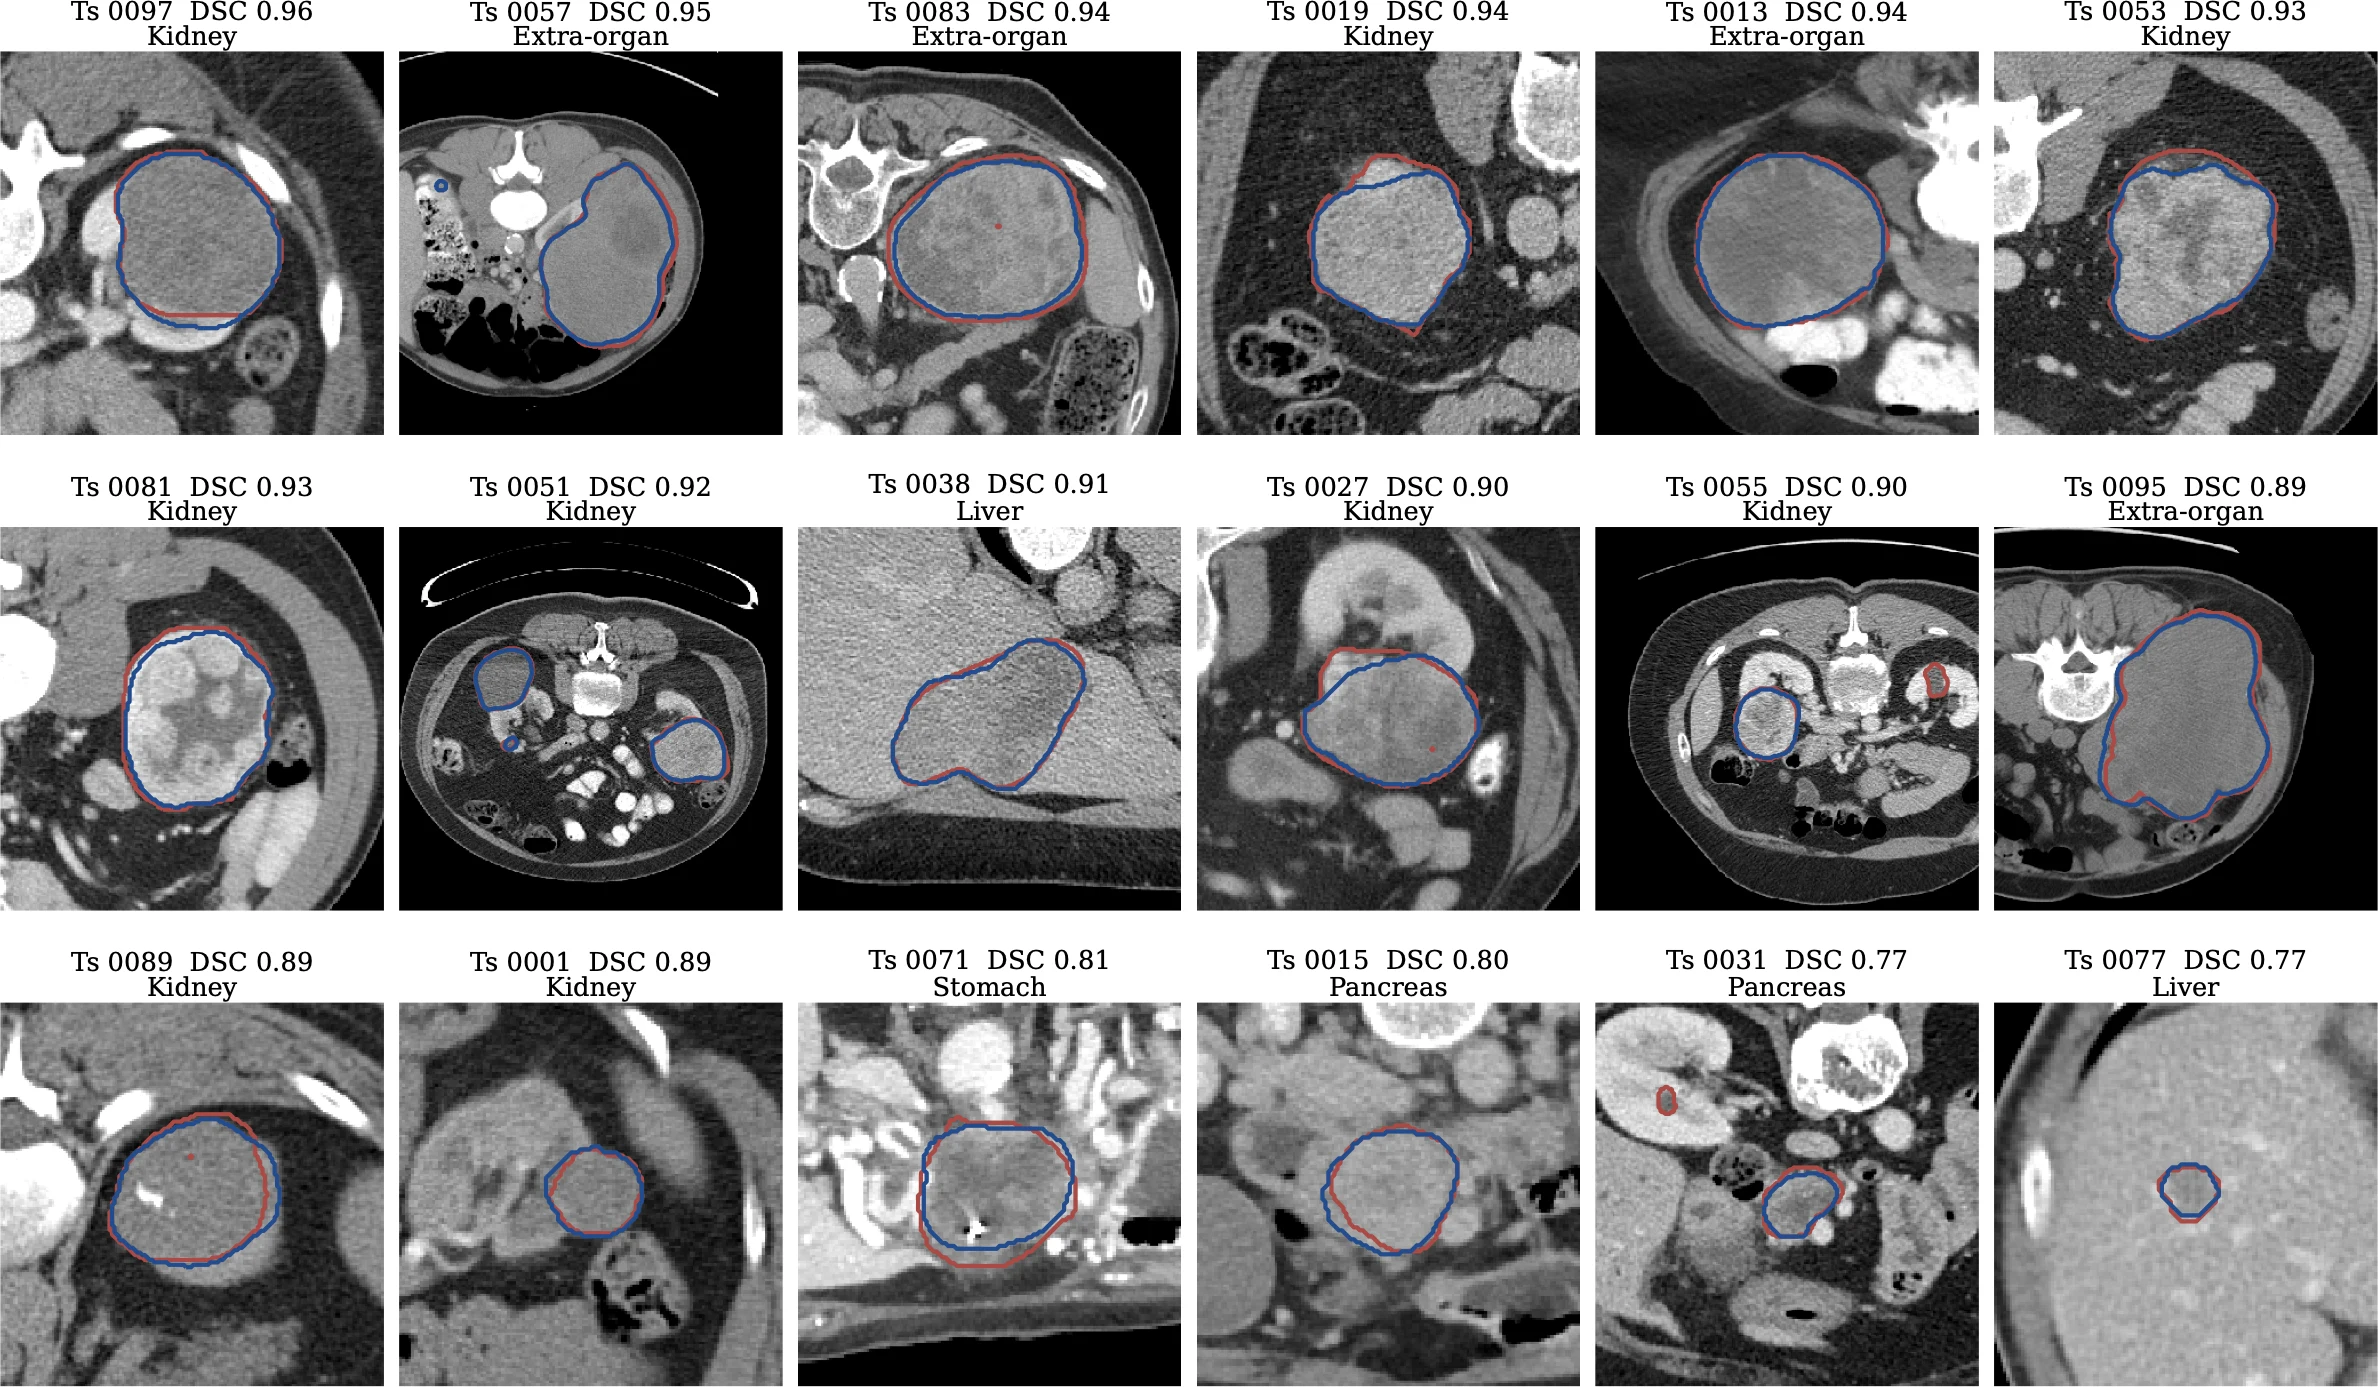
We built the AI model powering it, OmniLesion, for the MICCAI FLARE 2026 pan-cancer challenge, where Nucleo won the award for the best segmentation accuracy. We then tested it on scans where radiologists had outlined every lesion. It found about 7 in 10 lesions larger than 1 mL, and where it found one, its outline mostly matched the radiologist’s. Most of its false alarms were very small, under 1 mL.
Follow-up made easy
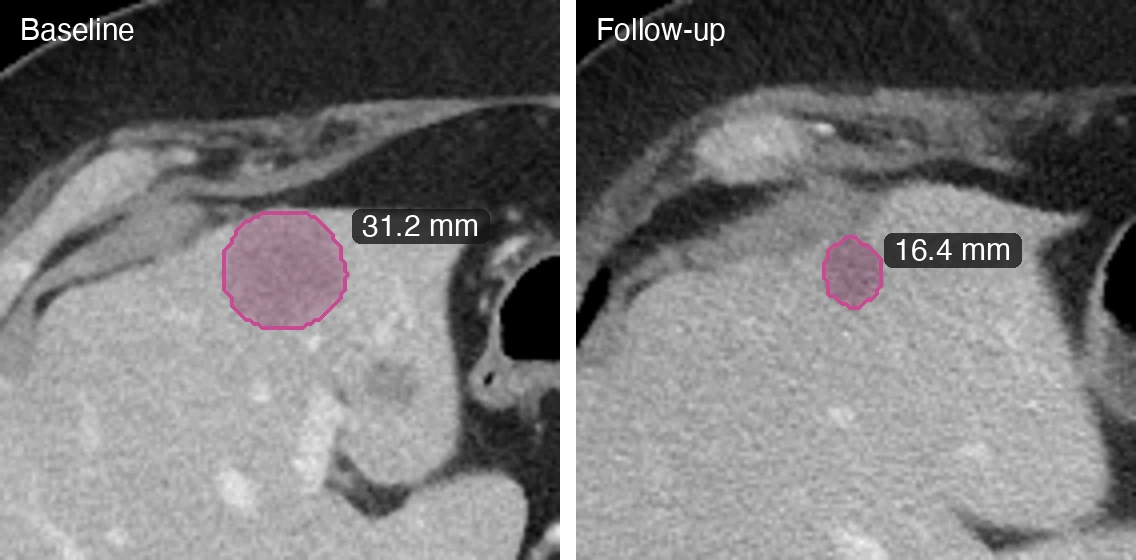
Nucleo supports RECIST 1.1. You pick the target and non-target lesions on the baseline scan, and on each follow-up it finds the same lesions again and pairs them up for you to check. Diameters come from calipers you accept: the long axis, or the short axis for lymph nodes. New lesions and the overall response are recorded with the rest. Results export as CSV, CDISC SDTM tables (TU, TR and RS), DICOM-SEG or NIfTI masks, and PDF reports.
Lung nodules
A dedicated high-resolution stage finds small nodules. For every nodule you get its volume and equivalent diameter, the long and short axes in each plane, the lobe, the density type with HU percentiles, and the detection confidence. We also offer a research model that estimates how likely each nodule is to be malignant.
Lung nodule analysis can also run on its own, without the whole-body lesion pipeline, and support single-click manual segmentation.
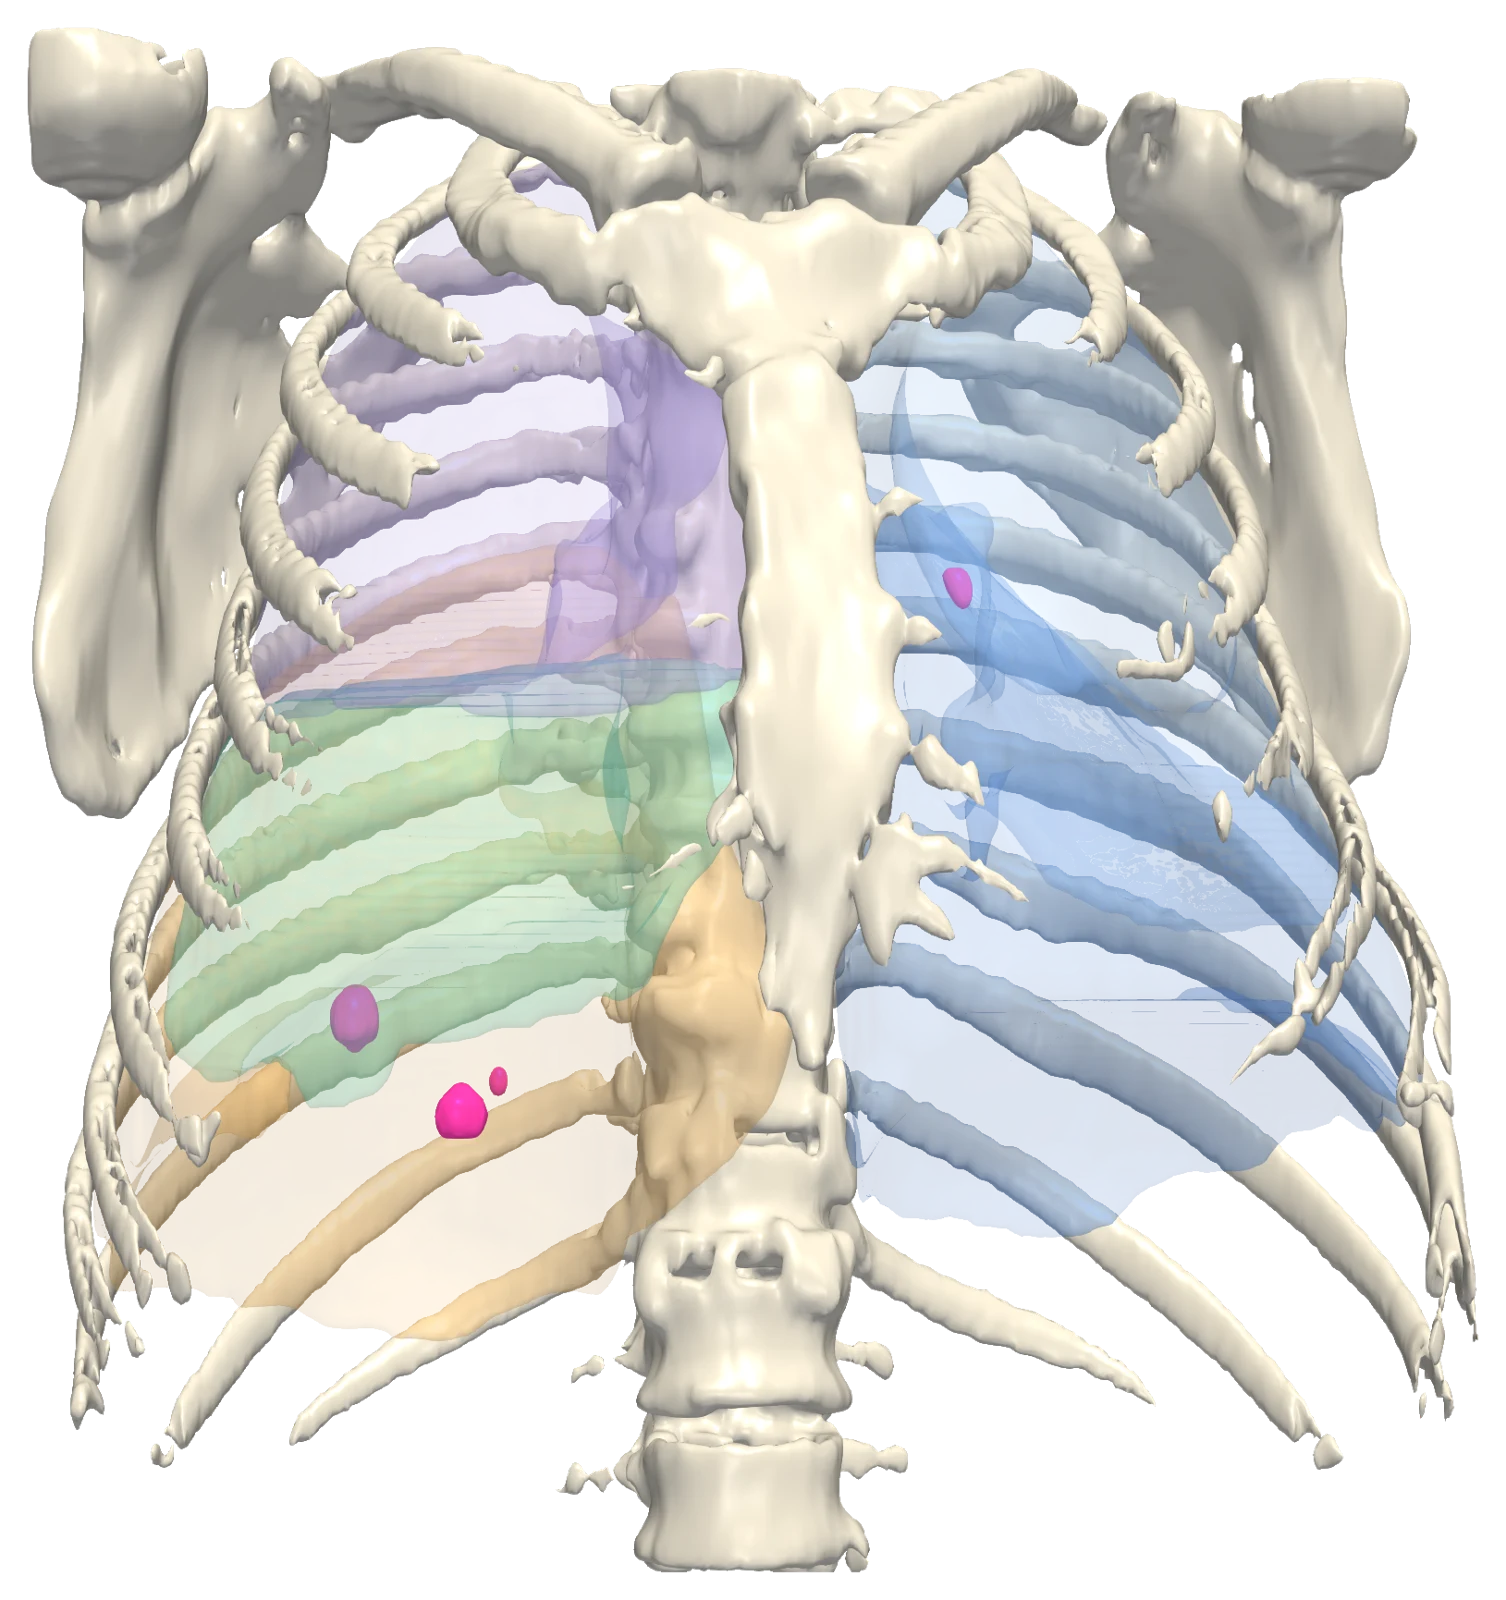
- Right upper lobe
- Right middle lobe
- Right lower lobe
- Left upper lobe
- Left lower lobe
- Lung lesion
Accuracy
Pan-cancer
- 81.2%1
- Lesion Dice
- 76.4%1
- Lesion surface Dice
- 0.6792
- Lesion sensitivity
Lung nodules
- 0.9853
- Detection sensitivity
- 0.62 mm4
- Diameter error
- 0.8925
- Malignancy AUC
- 0.8735
- Malignancy sensitivity
- FLARE 2026 hidden validation set, 100 CT scans. Best Pan-cancer Segmentation Accuracy award.
- Lesions of 1 mL or more, on 50 CT scans with every lesion labelled.
- At 4 false positives per series, on held-out thoracic CT series.
- Mean error on 207 nodules agreed by at least three radiologists.
- Research model, for research use only. 411 held-out nodules from 139 patients (71 malignant).
Questions
Do I have to say where to look?
No. The model searches the whole CT and returns every lesion it finds, across organs.
Is the lung classification a diagnosis?
No. It is a research classification, run on request and shown as a category with a confidence level. It does not establish a diagnosis.
Where does it run?
Lesion analysis runs on Nucleo's cloud. Results open in the app and export to CSV, CDISC SDTM, DICOM-SEG, NIfTI and PDF.
See it on your own scans.
We can walk through Lesion Analysis on a real study and show the outputs end to end.
Book a demo